Analytics & reporting
Improve your dealflow with analytics
Analyze deal, relationship, and interaction data to improve investing workflows
.webp)








.webp)
Analytics and reporting that drive better decision-making
Team activity and performance
Track performance; maintain momentum

Deal sourcing insights
Understand what channels drive deal success

Stakeholder reporting
Keep LPs and portfolio companies informed
Reinforce behaviors that win deals
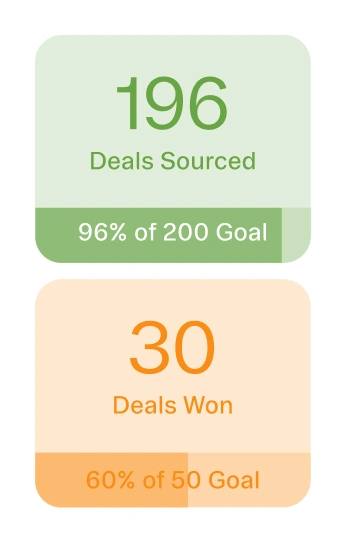
Make smarter decisions faster. Track win rates by individual, team, region, industry, or other metrics and gain a better understanding of team activity and performance. Track performance and maintain momentum with automated dashboard alerts anytime team activity, deal flow, or company/people metrics hit custom set parameters.


Put resources where you win most
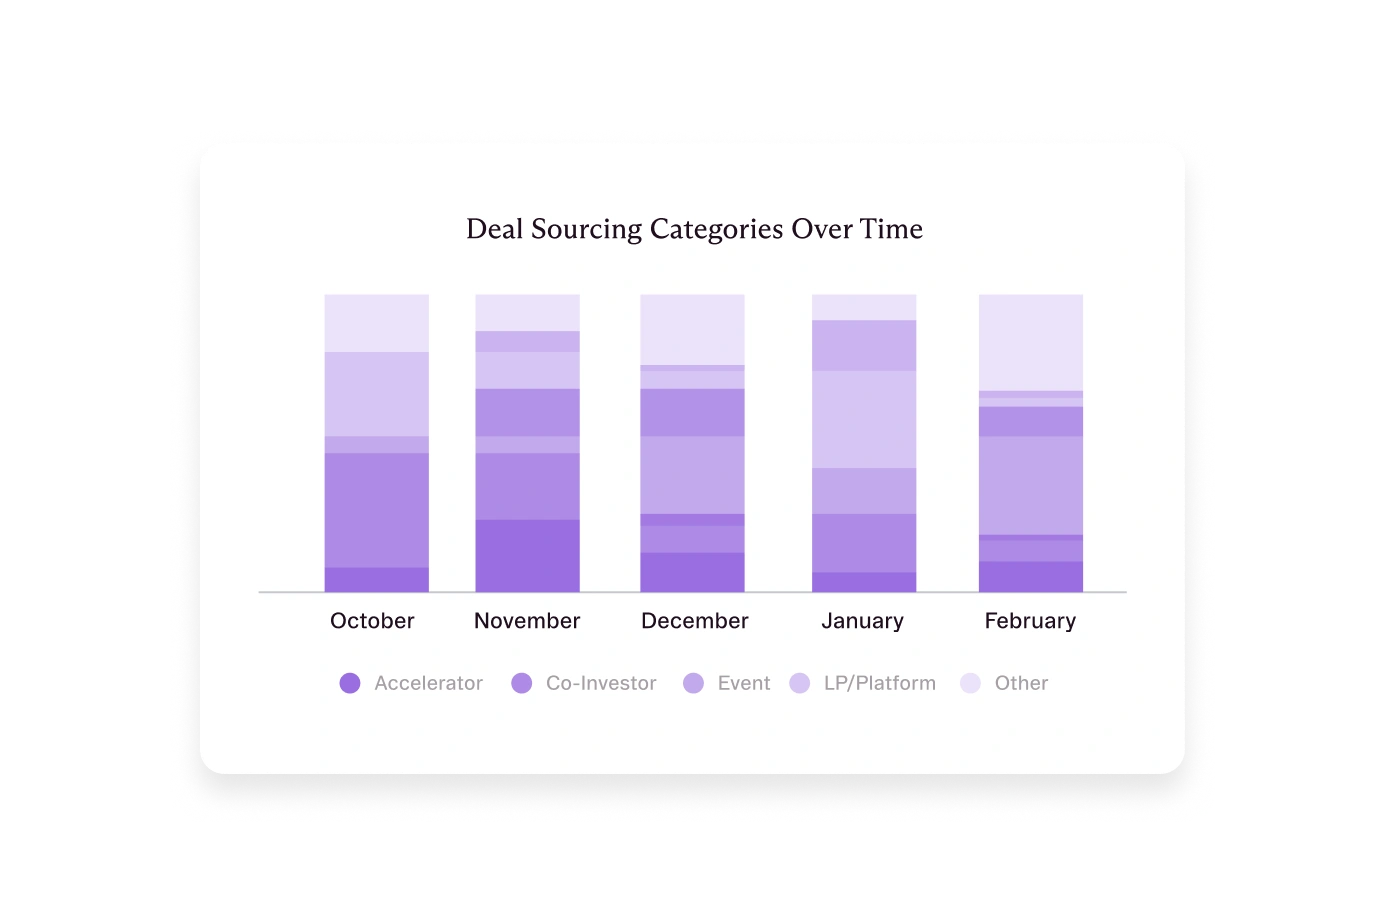
Double down on your strongest deal sources. Use Affinity’s enriched company firmographic, funding, and growth data alongside your proprietary data to visualize opportunities from source to close, refine outreach efforts, and glean insight from the performance of deals that were passed on.
Visualize your competitive edge for founders and LPs
Drive lasting relationships with quantifiable insights about your firm’s work. Track fund performance alongside diversity/impact goals while analyzing LP engagement to facilitate future fundraising. For portcos, instantly pull data on the number of introductions you’ve made to support business growth and showcase the value of your network.
.webp)
Where to next?

A CRM built for private capital
Support for workflows from deal sourcing to fundraising and portfolio support.

Deal analytics in action
Dive deeper with a full video overview of Affinity’s analytics tool.

Quantifiable portfolio support
See how Affinity’s introduction summary reports work.

API and data integrations
Pull data into Affinity from other tools in your tech stack.

"Implementation was really easy. We were able to start using the platform straight away."


"Having a well-defined, clean, golden source data set is more important in the age of AI. That's a lot of the benefit we're seeing from Affinity."


"It's night and day. We are way more organized when it comes to relationships. We've won a good amount of deals we wouldn't have won if we hadn't changed over to Affinity."


"Venture capital is a craft, and Affinity is one of the tools helping the investment team build this craft better."

Frequently Asked Questions
Where opportunities come from, how far each source converts, and how long each stage takes. Sourcing volume by itself says little since a channel producing many looks and no investments is a cost, not an asset. The measures that change behavior are conversion by source and time in stage, tracked consistently enough to compare across periods.
Because it depends on someone selecting a source from a dropdown at the moment a deal is created, often before the origin is clear. The attribution then never gets corrected. Systems that record the actual first interaction and the relationship path behind it produce attribution from evidence rather than from a field someone filled in early.
Affinity reports on pipeline by stage, source, owner, sector, and geography; conversion and time in stage between them; relationship coverage across the firm's network; and portfolio and deal activity for LP reporting. Because activity capture is automatic, the underlying data reflects what happened rather than what was logged.
Yes. Affinity segments pipeline and conversion by any field a firm tracks, including team, sector, geography, and deal source, so a firm can compare performance across sectors or offices. Results can be filtered to a fund or strategy where permission sets restrict access.
Yes. Deal, relationship, and portfolio data can be pulled on a schedule through Affinity's APIs, or delivered straight into Snowflake, Databricks, or BigQuery. A team that has already built its dashboards elsewhere points them at that data and keeps the reporting it has.
Affinity holds portfolio and deal activity as structured records, including the introductions, hires, and follow-on connections a firm has provided. LP updates are assembled from that captured activity instead of reconstructed each quarter, which is the difference between reporting a number for portfolio support and asserting that the firm provides it.
Put your firm’s network to work