How do you monitor a private credit portfolio? A Lumonic and PitchBook workflow, from covenant breaches to a source behind every number.


Firms pour months into getting a deal to close, and then hand the portfolio off to a spreadsheet. Every quarter someone rebuilds the view by hand: chasing reported numbers out of inboxes, re-keying them into static files, and finishing just in time for the data to be stale. A connected AI workflow keeps the picture current instead. It flags which companies are off plan against their covenants, prices how the market would treat a breach today, and traces every number back to the exact source cell, all in one session.
The workflow runs in Claude with two connectors switched on: Lumonic, which holds what your portfolio companies reported, and PitchBook, which holds what the market is doing. Lumonic tells you where a company stands; PitchBook tells you what that standing is worth right now. Each step is one plain-language prompt, and the full sequence sits at the end, ready to run in order. The demo ran on private credit, but the prompts work on any portfolio where companies report numbers to you, so change what's in the brackets to fit yours.
Why is portfolio monitoring still stuck in spreadsheets?
The data usually exists. What's missing is a current view of it, because the moment a quarterly refresh is finished, it starts aging.
"The lag is the real problem, not the data itself. By the time you've assembled a complete portfolio view, it's already out of date." — Kyle Turner, Head of Solutions Engineering, Affinity
The habit is stubborn because monitoring sits far from the money. By Lumonic's count, around 60% of private credit firms still run this on spreadsheets, and manual refreshes are the first task to slip when the team is busy. Your LP updates and your decisions are only as current as the last time someone re-keyed a file.
How do you spot which companies are off plan?
Start with the question every monitoring cycle is asking: who has drifted outside the lines? One prompt checks the whole portfolio against its commitments.
Which of my portfolio companies are off plan or out of compliance right now? Show me each commitment, the threshold, and where they actually came in.
It works on anything a company reports against: covenants on the credit side, KPI or revenue commitments on the equity side. In the demo, the fictional company Harrowline flagged at 4.1x leverage against a 4.0x limit, and MAKR Labs at $1.36M ARR against a $1.5M minimum. You get the breach, the threshold, and the actual figure in one view rather than a quarter's worth of spreadsheet reconciliation.
How do you know whether a breach is a problem?
A number over a limit isn't automatically a problem. Whether it is depends on what the market would do with that company today, and that's where the second data source earns its place.
Focus on [company]. It's out of compliance. If we had to take it back to market today, what would we get, and is this a problem? Use current market terms.
The model pulls live market terms from PitchBook and reasons to a verdict instead of just restating the miss. In the demo it priced a refinancing of the breached company at today's terms and judged it manageable, over its own covenant but well inside what the market would still do. That blend, reported position against live market reality, is the analysis a single data source can't produce.
Can you trust the numbers?
Every figure above is only useful if you can defend it, and in private credit and private equity, defending a number means tracing it to its origin.
"They need to look at a number and track it back to the source. Auditability is one of our core differentiators—you can click on anything inside Lumonic and get back to the file it came from." — Kevin Hsu, CEO, Lumonic
Show me exactly where [company]'s number comes from.
Ask where a number comes from and you get a clickable link straight to the source cell in the reported document. The same holds inside a valuation model: because valuations get audited, and an auditor will ask you to show how you reached a figure, every dependency traces down to where it originated, in one click.
How do you keep watching without rebuilding the report?
The point of all this is to stop starting from scratch each quarter. One plain-language request turns the whole thing into a monitor that runs for the life of the position.
Set up a standing watch on my portfolio: flag any company that breaches a commitment or comes within [5%] of one, and for each, tell me how the market would price it today. Run it now and show me who's flagged.
From the same setup, each of the artifacts a monitoring team rebuilds by hand is a single ask:
Build a full monitoring report on [company] from what it reported. Build an Excel valuation model that prices [company]'s reported EBITDA against live market multiples for its sector.
Score every position in my portfolio by what the market is doing around it, and show me total exposure.
The market side re-prices as conditions move, so the view stays current on its own.
What you end up with
A portfolio picture that reflects this week, not last quarter's spreadsheet: who's off plan, whether it matters at today's market terms, and a source behind every number. Lumonic supplies what your companies reported. PitchBook supplies the market reality around them, and the two blend into analysis neither could produce alone.
Upstream, the deal and relationship history a firm captures in Affinity hands off at the stage change from pipeline to portfolio, and because Affinity connects with PitchBook, the market data grounding your monitoring is the same layer grounding your next deal.
The full workflow, copy and run
Here is the whole sequence in order. Copy each step into the AI assistant your firm uses, with Lumonic and PitchBook both connected. Change what's in the brackets to fit your portfolio.
1. Find who's off plan
Which of my portfolio companies are off plan or out of compliance right now? Show me each commitment, the threshold, and where they actually came in.
2. Check whether a breach matters
Focus on [company]. It's out of compliance. If we had to take it back to market today, what would we get, and is this a problem? Use current market terms.
3. Trace any number to its source
Show me exactly where [company]'s number comes from.
4. Set a standing watch
Set up a standing watch on my portfolio: flag any company that breaches a commitment or comes within [5%] of one, and for each, tell me how the market would price it today. Run it now and show me who's flagged.
5. Pull the artifacts (each a single ask)
Build a full monitoring report on [company] from what it reported. Build an Excel valuation model that prices [company]'s reported EBITDA against live market multiples for its sector.
Score every position in my portfolio by what the market is doing around it, and show me total exposure.
Where monitoring meets the rest of the deal lifecycle
Lumonic and PitchBook run this workflow on their own so you don't need anything else to keep the portfolio current. Affinity sits on the other side of the same market-data layer. It connects with PitchBook upstream, so the relationship and deal history that sourced a deal carries through to how you monitor it after close. Talk to our team about connecting the deal lifecycle end to end.
More AI workflows across the deal lifecycle
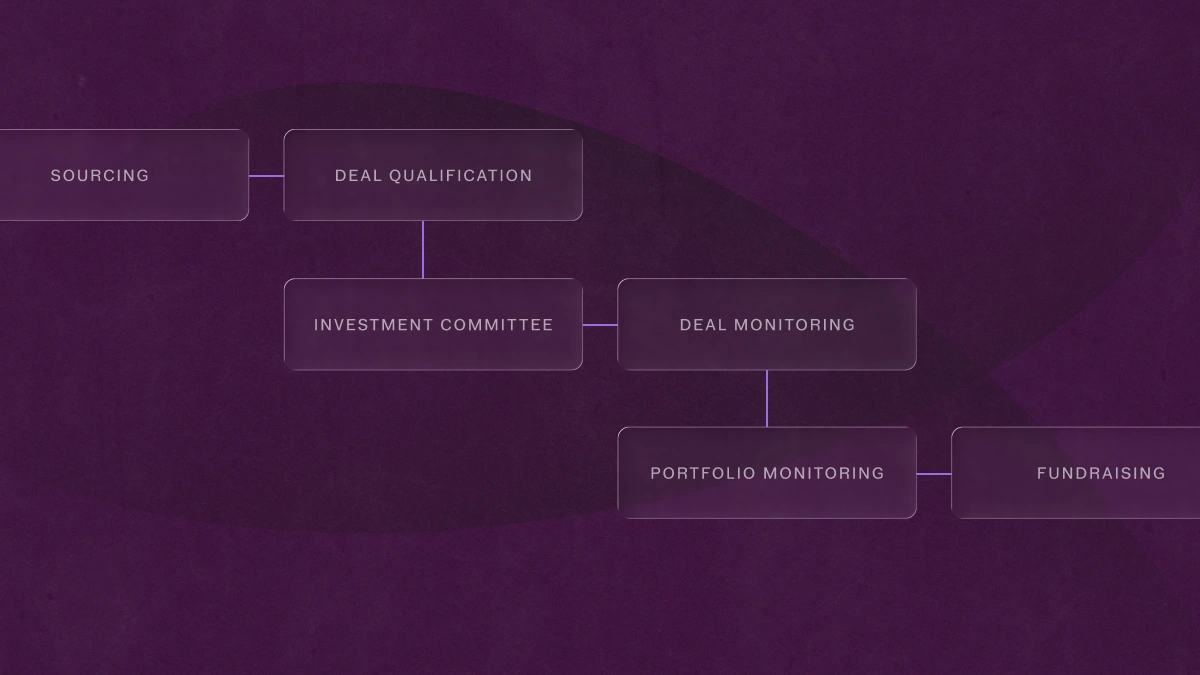
This is one stage of a four-part series on connecting AI to where your firm's work already lives.
- Start here: Putting AI to work across the private capital deal lifecycle—the full thesis and all four workflows
- Sourcing (Grata): How do you find off-market companies to acquire?
- Diligence (AlphaSense): How do you use AI for due diligence?
- Sourcing (Crunchbase): How do you find emerging startups before they raise?
FAQ
How do you monitor a private credit portfolio?
Connect the system holding your companies' reported figures to a market-data source through an AI assistant, then ask in plain language which companies are off plan, what a breach would be worth at today's market terms, and where each number came from. This replaces the manual quarterly spreadsheet rebuild with a view that stays current and traces back to source.
What does covenant monitoring with AI look like?
You ask which portfolio companies have breached or are near a covenant threshold, and the workflow returns each commitment, its limit, and the reported figure, flagging the ones off plan. A standing version runs continuously, flagging any company that breaches or comes within a set margin of a commitment.
Can AI value a portfolio company?
Yes. With reported financials and live market comparables connected, an AI workflow can build a valuation model, in Excel, that prices a company's reported EBITDA against current market multiples. Because the output is auditable, each figure traces back to the source it was derived from.
Why does auditability matter in portfolio monitoring?
Valuations and LP reporting get audited, and an auditor expects to see how a number was reached. A workflow where every figure links back to its source document lets a firm defend its marks and reporting without reconstructing the trail by hand.
What should private credit firms look for in portfolio tracking software?
The priority for portfolio tracking in private credit is current data with a clear audit trail: figures that update as companies report instead of a quarterly manual rebuild, and every number traceable back to its source document. Pairing reported data with live market data also lets the same system price a covenant breach at today's terms rather than only flag it.
Related Articles


Put your firm’s network to work